Datasets
The data on intimate partner violence against women was meticulously gathered and
modeled by the United Nations Inter-Agency Working Group Against Women Estimation and
Data. This includes agencies and organizations such as UN Women, UNICEF, UNODC, etc. The
actual data derived from using a multilevel regression model that integrates data from specialized
surveys on violence against women, national health surveys, crime victimization surveys, and
other relevant sources.
These surveys, conducted between 2000 and 2018, adhere to specific
criteria to ensure validity and comparability. The in-depth methodology is used to harmonize data
across diverse cultural definitions and reporting practices to provide reliable prevalence in
estimates on intimate partner violence, regionally, nationally, and globally.
Map A: Global Proportion of Women Experiencing Domestic Violence

Map B:
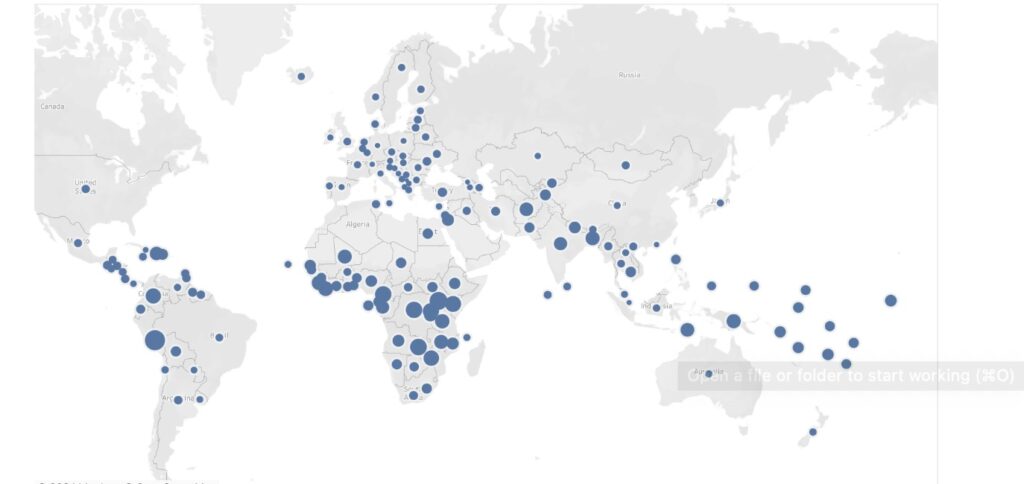
Chart A: Proportion of women who have ever experienced intimate partner violence (%)
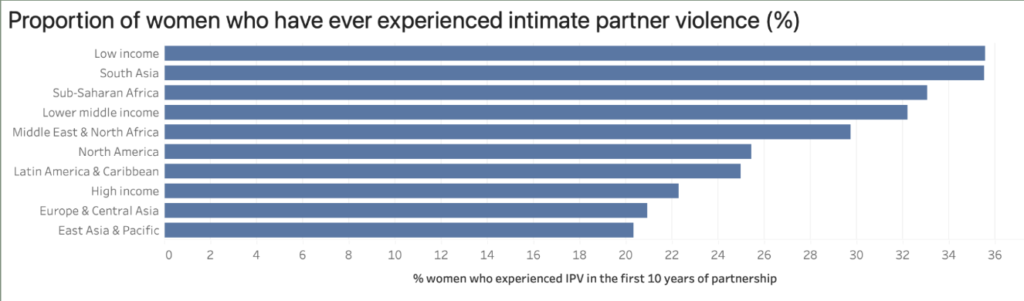
The following bar chart illustrates the proportion of women who have experienced intimate partner violence within the first ten years of partnership. It was categorized by GDP and regional qualifiers and chosen over an individual country chart given its clearer comparative analysis across various economic classes and regional contexts. Ultimately, this percentage is highest amongst the factors that they belong to a low-income class and are within Southern Asia. The indicator with the least percentage includes those who live within East Asia and the Pacific.
This chart was made using Tableau. Based on the main data set from our project, “Proportion of women who have ever experienced intimate partner violence”, we developed a bar chart illustrating the percentage of women who experienced intimate partner violence (IPV) within the first ten years of partnership across regional qualifiers and varying GDPs. We found the highest rates of IPV in low income countries as well as South Asia at around 35.5%. A journal article published in 2023 discussed their study on the prevalence of IPV across 53 countries. They surveyed 359,479 women in which they also discovered that women from low income countries faced the highest risk for IPV at a prevalence of 48.1%, aligning with the findings from our chart. Socioeconomic factors such as poverty, economic hardship, and stress, that are extremely pervasive in low income regions contribute to the high rates of IPV. These factors also limit resources available to support women experiencing IPV, such as healthcare and social support. Additionally, there is a strong correlation between low income regions and high gender inequality; these societies tend to have a strong patriarchal structure, where men hold dominance and privilege and women tend to be less socially and financially independent, which further contribute to high rates of IPV. According to our data, the lowest rates of IPV were found in East Asia and the Pacific, at around 20%. However, this is contradictory to other studies which report some of the highest findings of IPV in these regions. IPV data collection is often not reliable due to the differences in what is considered “violence”across cultures. False reports also occur due to IPV being taboo and not socially acceptable to discuss, further resulting in skewed data.
Chart B: Percentage of women whose first experience of spousal physical or sexual violence was within ten years of marriage by year

The percentage of women whose first experience of spousal physical or sexual violence within the first ten years of marriage by year creates using a treemap creates a visual representation of IPV by year. It seems as if 2016 and 2018 are more significant years when it comes to this graph, and it may point to certain things that may have happened during that year. While there is no definite correlation just on this graph alone, this could help explain when there was a first experience of spousal violence.
For the second chart we used Tableau. Using our main data set for our project, “Proportion of women who have ever experienced intimate partner violence,” we found that between 2015 and 2020, the highest rates of IPV were in 2016 and 2018. According to the National Domestic Violence Hotline website, in a single day, there were 31,500 women and children fleeing domestic violence situations who were seeking shelter. However, 12,197 of those requests were unable to be met due to a lack of funding and staffing in the agencies. According to the website, the need for housing is the top request for people fleeing DV situations and without proper resources. According to a national study published in 2009 provided by the guardian, the rates of domestic violence against women has been steadily on the rise. Additionally, there has been a decline in violent crimes being reported as the cuts to domestic violence services have been increasing. Meaning, as services are being slashed, women are simultaneously being silenced about their abuse. Our hypothesis, coinciding with the chart, is that the levels of domestic violence are most likely due to the lack of available services. Consequently, this may put women in dangerous positions as they are more likely to return to their abuser if they are unable to find the resources they necessitate.
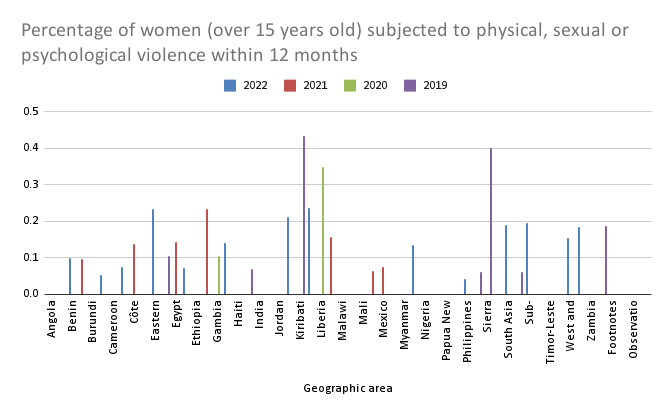
Chart C: Percentage of women (over 15 years old) subjected to physical, sexual or psychological violence within 12 months
Data Critique
The dataset on intimate partner violence that is located on the World Bank Gender Data Portal is funded and created by the World Bank Group. This includes versatile data sets that provide information on violence against women in all countries. This data is important for creating new world policies in terms of gender. Multiple donations were given to deliver an accurate representation of data. The dataset includes data on the proportion of women who have ever experienced intimate partner violence as well as the proportion of women whose first experience of spousal, physical, or sexual violence was within ten years of marriage across countries by a former or current partner. There exists a distinct and significant gap of missing information in the latter dataset compared to the first dataset across countries, with data collected only from 38 of 217 countries. According to the Global Gender Gap Report 2020, 32% of females in North America were found to be victims of abuse in comparison to 19% of women in Eastern Europe and Central Asia. This data, and overall data, on domestic violence, is often unreliable and invalid due to differences in what constitutes violence or abuse across countries and cultures. It is also often difficult to collect data due to ethical reasons. Missing information is also due to the taboo nature of domestic violence and the issue not being socially acceptable to discuss, which affects results during surveys. This problem in data collection would be especially prominent during new or current marriages, explaining the significant gap in data in women reporting violence or abuse during their first ten years of marriage.